Data Sciences
We understand the importance of data in today's world. We constantly strive to provide our clients critical analytical insights that can help them make informed decisions.
The Last Minute
Despite having six months after the end of the fiscal year to conduct the AGM, companies tend to bunch up their AGMs towards the end of this period. Most companies have a March year-end. Consequently, the maximum number of AGMs are held in September (six months from March).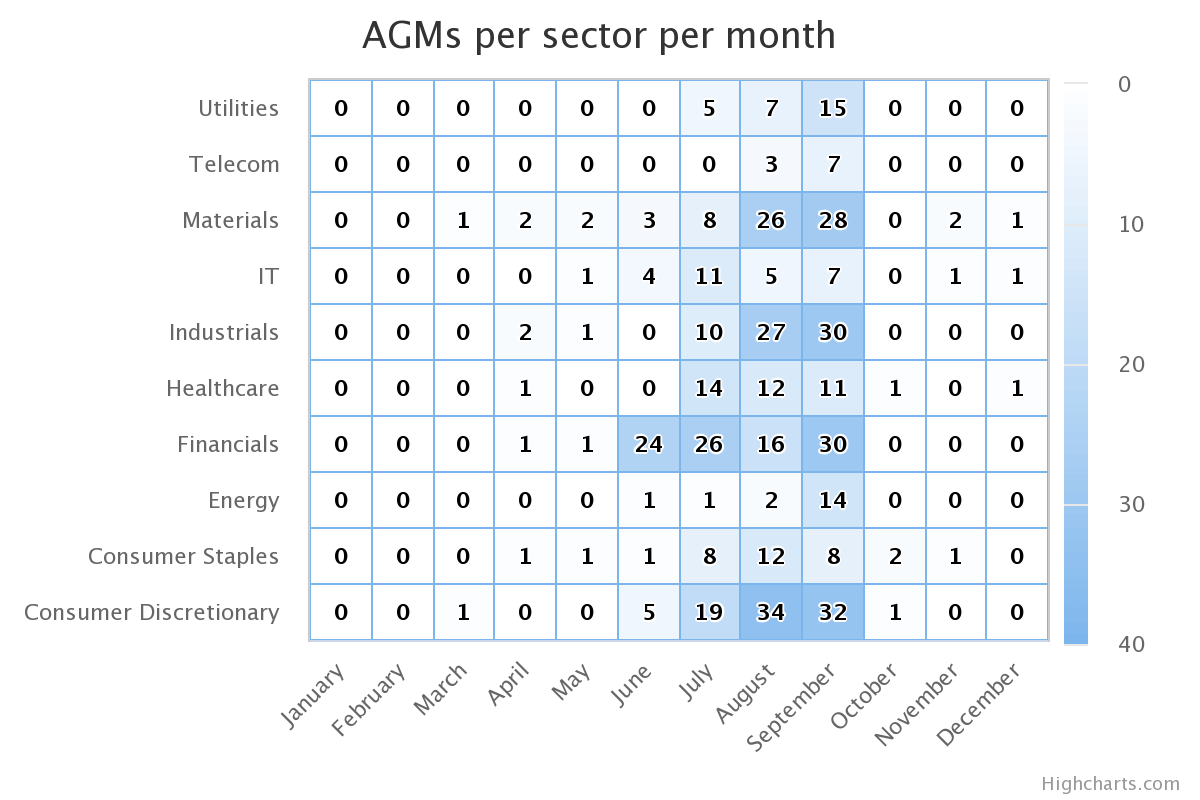
Heatmap of AGM counts across ten sectors by month. AGMs cluster between July and September and peak in September — for example, Industrials and Financials each hold 30 AGMs in September and Consumer Discretionary holds 34 in August — with almost none held from October to May.
Pay Structure
Ideally, compensation for top executives in the company must be linked, to a large extent, with the company's performance. This implies that there must be a large component of variable pay in the overall remuneration structure. In India however, the quantum of variable pay has declined over the last few years and is much lower compared to global standards.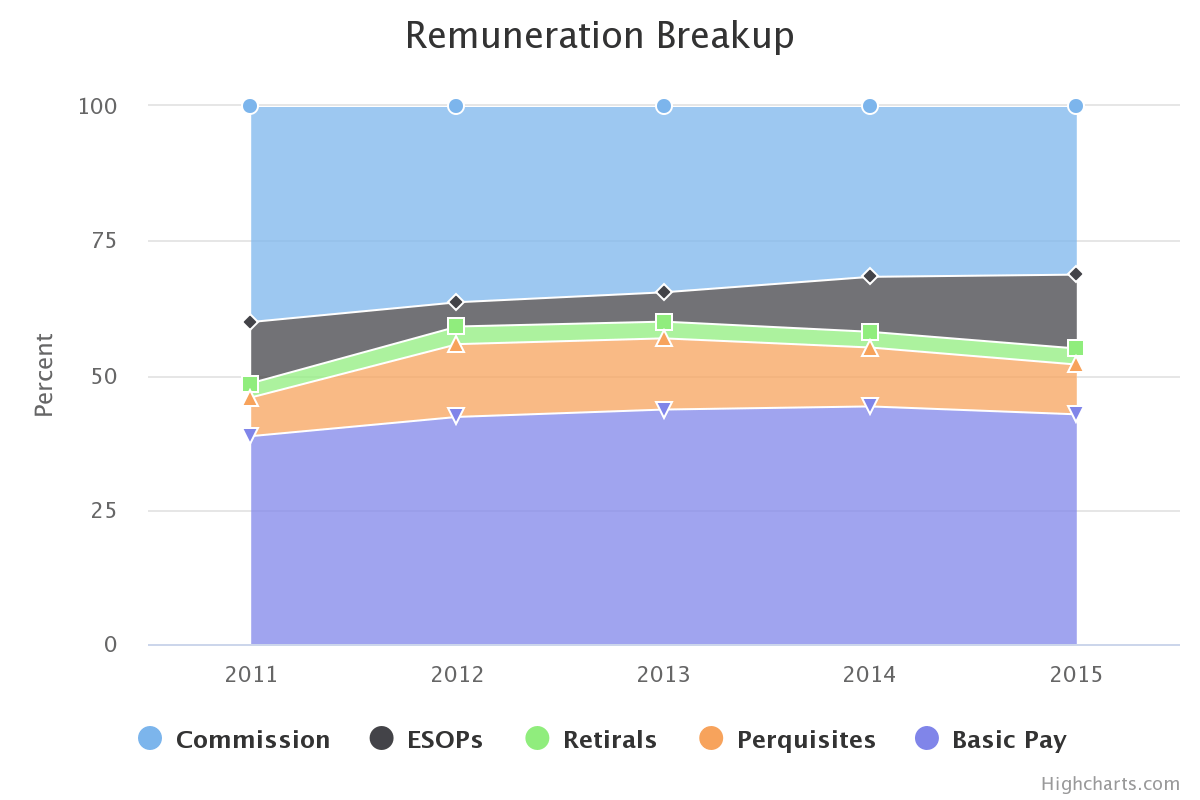
Share of executive remuneration by component from 2011 to 2015. Basic pay rose from about 40% to 44% and perquisites from about 7% to 9%, retirals stayed near 3%, and ESOPs grew from about 11% to 14%, while commission — the main variable component — shrank from about 40% to 31%.
Top Paying Industries
Some industries tend to pay more to their executives as compared to others. This is because the dynamics of each business are different and therefore, so are the deliverables for the top executives in those companies. The chart to the right shows the top 5 industries in terms of median executive compensation. Clicking on a particular industry will display the highest paying companies within that industry.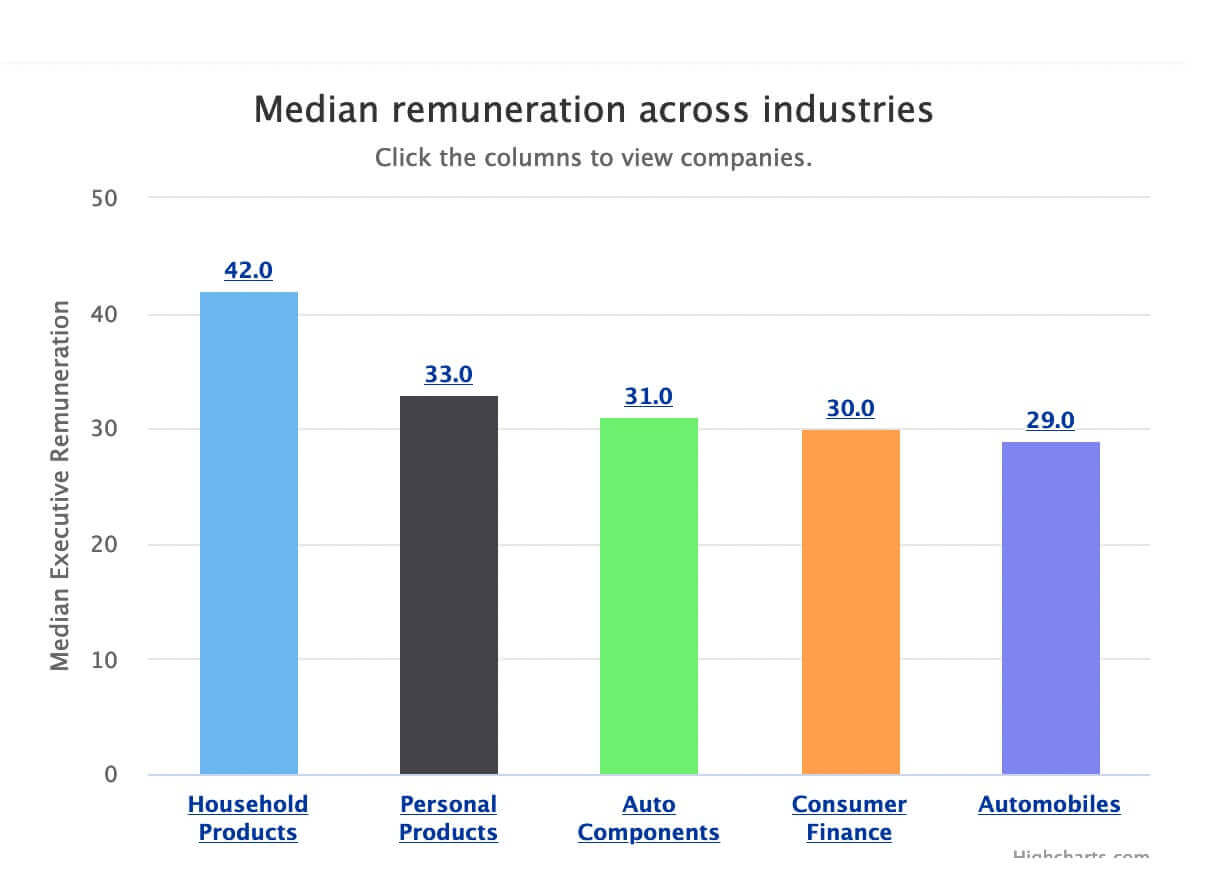
Median executive remuneration by industry: Household Products 42.0, Personal Products 33.0, Auto Components 31.0, Consumer Finance 30.0 and Automobiles 29.0.
CSR Spends
IiAS believes that corporates are embracing Corporate Social Responsibility (CSR) enthusiastically. Although the spend was 26% lower than the prescribed amount, the S&P BSE 100 companies spent Rs.52.4 bn on CSR in FY15 up almost 75% from Rs.30.0 bn in FY13. And this amount is further expected to increase to Rs.85.0 bn in the current financial year. Even as CSR is entering corporate consciousness, the next two to three years will remain a ‘learning period’ for industry.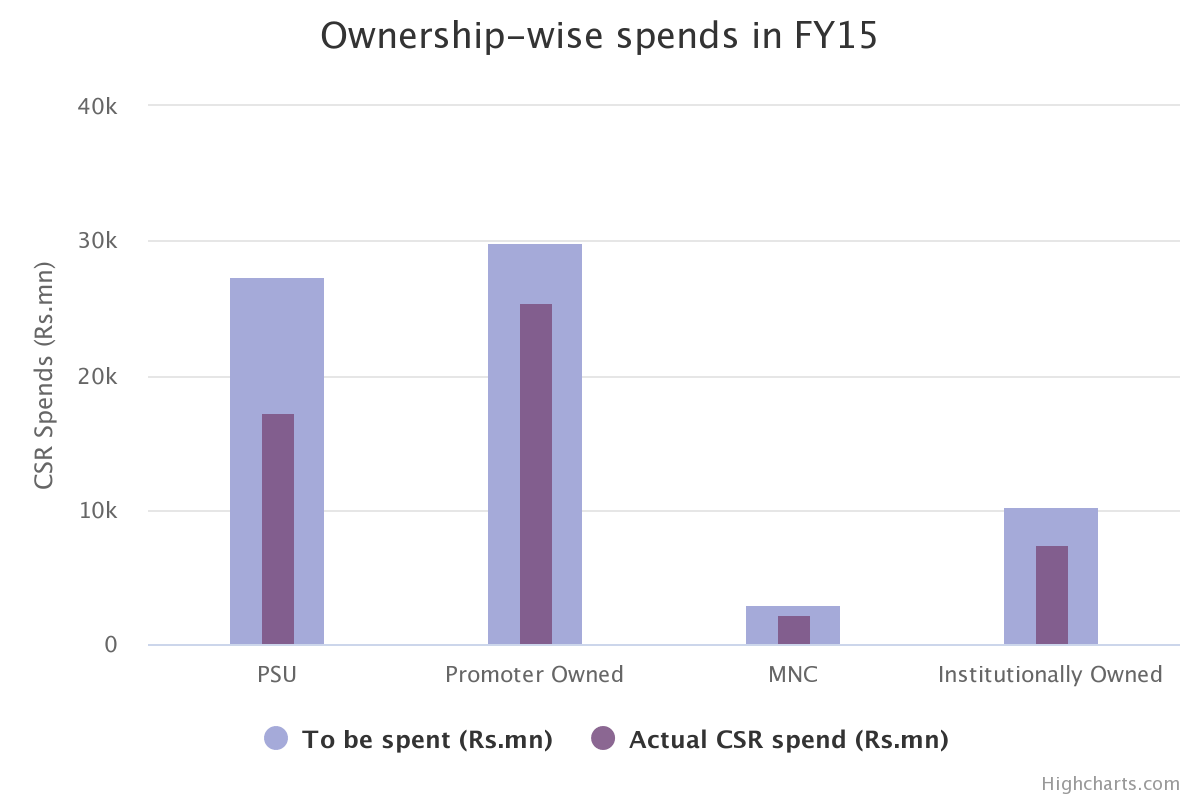
Prescribed versus actual CSR spend in FY15, in Rs million: PSUs about 27,000 prescribed versus 17,000 spent; promoter-owned about 30,000 versus 25,500; MNCs about 3,000 versus 2,200; and institutionally owned about 10,000 versus 7,300.
Mutual Fund Voting
SEBI has made it mandatory for mutual funds to disclose their voting data, along with the rationale for their voting decisions. Our data sciences team have collated the data to analyse the voting trends of all mutual funds across the S&P BSE 500 and NIFTY 500 companies. The insights help companies to identify critical talking points and engage with their investors. While mutual funds generally tend to vote along with the management, they have raised concerns on resolutions pertaining to stock options, auditor appointments and related party transactions.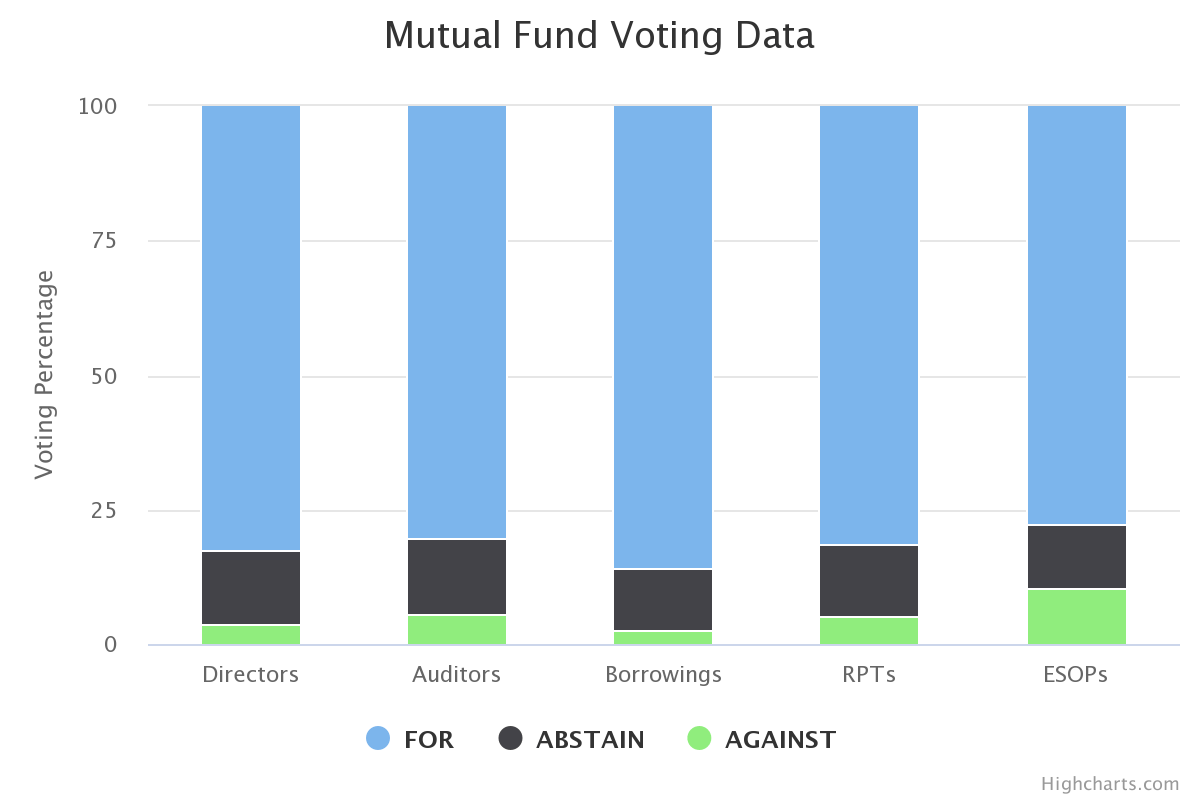
Share of mutual fund votes for, against and abstained across resolution types. Votes in favour dominate at roughly 78 to 86 percent. Against votes are highest for ESOPs at about 10 percent, followed by auditor appointments and related party transactions at about 5 percent; abstentions range from about 9 to 14 percent.